
Summary of drawdown for Australian retail traders
The five-line version:
- Drawdown is the percentage decline from your account’s peak equity to its lowest subsequent point, before a new peak is set
- Maximum drawdown is the largest such decline over the life of the account
- Current drawdown is the live distance from the most recent equity peak
- Recovery maths is asymmetric: a 25% drawdown needs a 33% gain to recover, a 50% drawdown needs 100%, an 80% drawdown needs 400%
- ASIC’s 50% margin close-out rule caps how far an ASIC-regulated retail account can draw down before positions are auto-liquidated, so you can’t normally drift quietly to zero
I would take drawdown over win rate as the first screen. A strategy that wins 70% of the time but takes a 60% drawdown when it goes wrong is worse than a 45% win rate strategy that caps drawdowns at 12%. The first one blows up the account. The second one survives to compound.
What drawdown actually measures
Drawdown is a peak-to-trough metric, so tracking starts from the last equity high. The percentage fall from that high to the lowest equity point that follows, measured before the account makes a new high, is the drawdown.
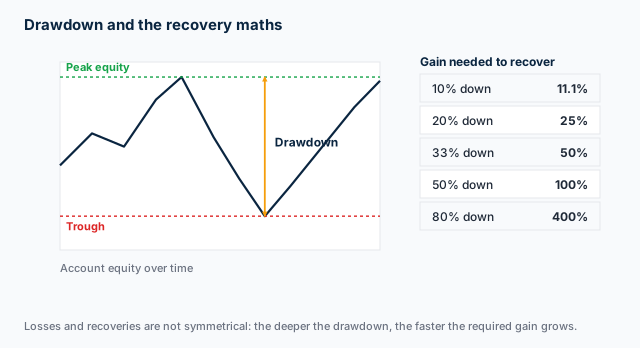
The diagram pairs the peak-to-trough distance with the recovery gain each depth demands: 11.1% after a 10% fall, and 100% after a 50% fall.
Once a new equity peak is hit, the drawdown clock resets and the previous figure is logged as a closed drawdown, which means the old decline stops counting against the new run.
Two flavours matter:
- Maximum drawdown (MaxDD), the worst peak-to-trough decline the account has ever recorded. This is the headline strategy stat.
- Current drawdown, how far below the most recent peak the account is sitting right now. If you’re at the equity peak, current drawdown is zero.
Traders also hear “average drawdown” and “drawdown duration” (how long the recovery took), and both have their uses, but MaxDD is the one that gets quoted.
A worked AUD example
You start with AUD 10,000. Here’s how a typical year might play out:
| Month | Equity | Peak so far | Drawdown |
|---|---|---|---|
| Start | AUD 10,000 | AUD 10,000 | 0% |
| Month 3 | AUD 9,200 | AUD 10,000 | 8% |
| Month 4 | AUD 7,500 | AUD 10,000 | 25% (trough) |
| Month 7 | AUD 10,500 | AUD 10,500 | 0% (new peak) |
| Month 11 | AUD 12,000 | AUD 12,000 | 0% (new peak) |
The maximum drawdown for that year is 25%, recorded at month 4. Even though the account finished up 20% on the starting balance, the worst point along the way was a 25% loss from the AUD 10,000 starting peak. That is the number I would show a fund-of-funds or prop desk, because it tells them how much pain the strategy can produce on the way to the result.
Why drawdown matters more than win rate
Win rate alone is a vanity stat. Two strategies can share a win rate and still produce wildly different drawdown profiles. The one with the smaller MaxDD is almost always the one I would point you toward.
The reason is the recovery asymmetry: losses compound against you faster than gains recover them. The percentage gain required to recover a drawdown is always larger than the drawdown itself.
| Drawdown | Gain required to recover |
|---|---|
| 5% | 5.3% |
| 10% | 11.1% |
| 20% | 25% |
| 25% | 33.3% |
| 33% | 50% |
| 50% | 100% |
| 60% | 150% |
| 75% | 300% |
| 80% | 400% |
| 90% | 900% |
Do the maths on an AUD 10,000 account: if it drops 50% to AUD 5,000, recovering takes a 100% gain rather than a 50% one, because the new lower base of AUD 5,000 must double back to AUD 10,000. That’s why traders call drawdown “the killer”: the dollar loss sets the size of the win you now need to climb back.
Professional risk management aims to keep MaxDD under 20 to 25% even when the underlying strategy could comfortably run hotter, because the recovery ladder gets steep. Once you’re 30% down, your required recovery is 43%. At 40% down it’s 67%. By 50% the strategy needs to literally double the remaining capital to break even, which most strategies can’t do without taking risks they’d never take from a fresh start.
The table above stops at round numbers, but the calculator below does not. Put your own peak and drawdown into it and it runs the same arithmetic on your account, in dollars as well as percent.
Acceptable drawdown by trading style
There’s no single “right” drawdown number. Acceptable depends on the strategy’s holding period, the leverage used, and the trader’s tolerance for variance. I would treat these as rough industry benchmarks for an ASIC-regulated retail forex account:
| Trading style | Typical holding period | Reasonable max drawdown |
|---|---|---|
| Intraday / scalping | minutes to hours | under 10% |
| Swing trading | 1 to 10 days | 10 to 20% |
| Position trading | weeks to months | 20 to 30% |
| Trend-following / systematic | months+ | up to 35% on managed-account standards |
A 20% drawdown on an intraday strategy usually signals one of three problems: stops too wide, position size too big, or the edge isn’t there. The whole point of the style is tight stops and high trade frequency, so a large drawdown means the edge is not doing its job.
Swing trading can absorb wider drawdowns because the strategy is held through more noise, so 15% is normal. 25% is the upper end before risk parameters need a review.
Position and trend-following strategies routinely produce 25 to 30% drawdowns even when the long-run performance is strong, and that’s the price of holding through countertrend moves.
Drawdown and ASIC’s 50% margin close-out rule
This is the AU-specific bit that doesn’t apply to traders in other jurisdictions.
ASIC’s Product Intervention Order (in force since 29 March 2021 and extended to 23 May 2027) requires retail brokers to close out positions when account equity falls to 50% of the initial margin used across open positions. This is regulatory, not broker discretion.
What this means in practice for drawdown:
You can’t quietly drift from a 60% drawdown to an 80% drawdown to a 100% drawdown on an ASIC-regulated retail account. The close-out rule kicks in and liquidates positions before the account can fully bleed out. Mandatory negative balance protection for retail clients adds another layer, so the balance cannot normally go below the cash deposited, even on a wild gap move.
Worked example: you deposit AUD 5,000 and open positions using AUD 1,000 of initial margin. Unrealised losses cut your account equity to AUD 500 (half of the AUD 1,000 of used margin). The broker must start closing positions, beginning with the largest unrealised loss.
The close-out rule effectively caps the drawdown that an unmanaged retail position can produce. It does not replace position sizing or stop-losses, but it stops the catastrophic wipeout scenarios that pre-2021 retail accounts could fall into. I would not rely on it instead of a stop-loss, and our leverage guide and stop-loss guide show how the close-out interacts with normal trade management.
Tools to track drawdown on an Australian account
Calculating drawdown manually is not necessary. Most platforms and third-party analytics tools track it automatically.
Third-party analytics
- MyFXBook, connects to MT4/MT5 accounts via investor password, tracks drawdown, win rate, profit factor, and most other strategy stats. Free for personal use. The standard tool for traders running EAs and wanting verified track records.
- FX Blue, similar feature set to MyFXBook, with a slightly cleaner trade-by-trade visualiser. Also free.
- TradingView’s strategy tester, backtesting drawdown on a Pine Script strategy, useful before you go live.
Broker analytics tools (AU)
Several ASIC-regulated brokers ship their own analytics dashboards:
- Pepperstone, Pepperstone Insights (Smart Trader Tools add-on for MT4/MT5) tracks drawdown, win rate, hour-of-day performance, and pair-by-pair P&L
- IC Markets, client portal includes a basic equity curve and drawdown chart per account
- CMC Markets, Next Generation platform’s account analytics tab tracks drawdown by month and instrument
- IG Markets, IG Academy and the Performance Analytics tab inside IG’s web platform
- FP Markets, MyFP Markets dashboard with trade-by-trade analytics
Set up MyFXBook on day one for any serious strategy. The history is much harder to reconstruct after the fact. For how these brokers compare beyond analytics tooling, see our ranked broker list.
Position sizing to keep drawdown under control
Drawdown isn’t something that happens to an account; it’s the result of position sizes chosen. Under ASIC’s 30:1 cap, retail forex traders can still over-size dramatically if they’re not careful.
The standard professional rule is to risk no more than 1% to 2% of account equity per trade. On AUD 10,000, that’s AUD 100 to AUD 200 of risk per trade. With a 30-pip stop on a major pair (where each pip on a mini lot is roughly AUD 1.50 at AUDUSD 0.65 (illustrative rate)), that’s a position size of about 2 to 4 mini lots maximum.
Run the same maths in reverse. If you want MaxDD under 20%, and 5 to 8 losing trades in a row can reasonably be expected at some point in any strategy’s history, the per-trade risk needs to be 2% or less. Risking 5% per trade with the same losing streak puts the account at 25% to 40% drawdown. That’s the territory where the recovery maths starts hurting.
For the fuller position-sizing arithmetic, our stop-loss page walks through it in more detail, and our position size calculator turns a balance, a risk percentage and a stop distance straight into a lot size.
None of this is unusual. ASIC recorded 68% of retail CFD investors losing money in the 2024 financial year, a figure our team compiles alongside the account sizes, trade frequencies and survival rates in our forex trading statistics Australia reference set. For the wider picture on managing what those numbers describe, start at our forex education hub.
FAQs
What's a normal drawdown for a forex trader?
Why is drawdown more important than win rate?
Can I lose more than my account balance from drawdown on an ASIC broker?
How do I calculate maximum drawdown on my own account?
What's the difference between drawdown and a loss?
Is drawdown the same thing as risk of ruin?
Related pages
About the author

Justin co-founded CompareForexBrokers in 2014 and has traded forex since 1998. Based in Melbourne, he has tested every ASIC-regulated broker on this site personally and has written for Forbes, Kiplinger, Finance Magnates, the Australian Financial Review and The Age. He holds a Bachelor of Commerce (Honours) and a Master of Marketing from Monash University. Justin is the co-founder and CEO of CompareForexBrokers.