
The key Australian forex numbers for 2026
If you only want the headline figures, here they are:
- Australia has roughly 170,000 active retail CFD and forex traders as of early 2026, based on ASIC-broker disclosures across the AFSL holders we track
- 68% of retail CFD investors lost money in FY2024, more than $458 million including $73 million in fees, per ASIC REP 828 (published 20 January 2026)
- The AUD is the seventh-most-traded currency globally, on one side of 6.1% of daily global forex turnover, per the BIS Triennial Survey 2025, final revised data (June 2026 release)
- Global daily forex turnover is USD 9.51 trillion, so the AUD’s share works out at roughly USD 580 billion a day, of which a relatively small fraction is settled in Australia
- Australia ranks eleventh as a trading centre, at about USD 201 billion a day, or 1.6% of global turnover
- The five largest ASIC-regulated CFD brokers by AU active client base are CMC Markets, IG Markets, Pepperstone, IC Markets and Plus500
- Retail trader demographics skew male (roughly 80 to 85%) and aged 25 to 44, with growing participation from the 45 to 60 cohort over the past three years
I treat these as a reference set rather than advisory figures. We maintain it so you can compare your own activity and outcomes against the wider AU market.
How big is the Australian retail forex market?
Australia ranks among the most active retail CFD jurisdictions globally even though the population market is comparatively small. I find the broker density the most telling part of that: 32 ASIC-regulated brokers sit on our tracked list offering retail CFDs locally, many with parent operations in the UK, Cyprus or Israel that route AU clients through the Australian entity, so you are trading into a heavily contested market. Participation rates explain the rest, because Australian retail traders trade more frequently than most global peers and have done so since the early 2000s.
Active trader counts
ASIC-broker public disclosures and PDS filings put the Australian retail CFD active client base at approximately 170,000 to 180,000 as of early 2026. I would treat that as the working number for active traders. You should read “active” as an account that placed at least one trade in the preceding 12 months. The total number of registered AU CFD accounts, active or not, is meaningfully higher: closer to 400,000 to 500,000 across all licensed brokers combined, so the gap between registered and active accounts is something you will encounter in broker marketing.
For context, you can trace the arc from ASIC’s 2018 (pre-PIO) estimate of around 110,000 active retail CFD traders. The COVID-era retail trading boom of 2020 to 2021 grew the market, the Product Intervention Order took effect in March 2021, and activity plateaued. It has stabilised since, so you can treat the current range as a steady-state baseline.
Account funding levels
Funded retail CFD account size in Australia averages around AUD 4,500 to AUD 6,500. The median is lower, typically AUD 1,200 to AUD 2,000, because account distributions are heavily right-skewed: a small number of high-balance accounts pull the average up. I think the median is the more useful number for an individual trader, because it better reflects what you are likely to fund.
Trade frequency
Active AU retail CFD traders place roughly 80 to 120 trades per quarter on average. High-frequency scalpers can reach 500+ trades per quarter, while position traders sit in the 20 to 40 range. Your frequency will depend heavily on platform mix: MT4/MT5/cTrader users tend to trade more frequently than proprietary-platform users like CMC Next Generation, which is why the averages vary widely by broker.
ASIC retail loss-rate data
Australia has no per-broker loss-rate disclosure, and I would not bother hunting for one. When ASIC made its product intervention order in 2020, it considered issuer-specific risk warnings as proposed in Consultation Paper 322 and confirmed it would not require them. Unlike brokers regulated in the United Kingdom or the European Union, an Australian entity publishes no standardised percentage of its own, which is why you cannot compare one local broker’s percentage the way you can in the UK or EU. The reliable Australian numbers come from ASIC’s own sector reviews.
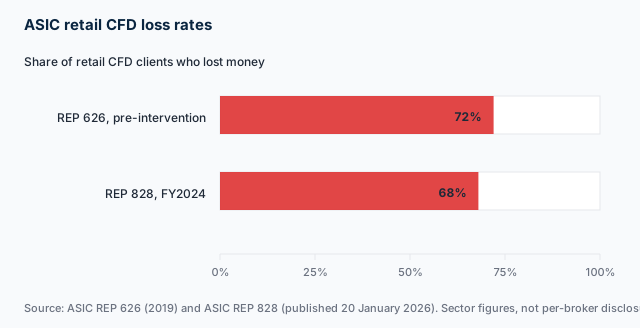
The chart puts the two ASIC sector figures side by side, so you can see the before and after: 72% of retail CFD clients losing money in REP 626 before the intervention order, against 68% in the 2024 financial year in REP 828.
What ASIC measured
ASIC’s REP 828 Risky business, published 20 January 2026, reported that 68% of retail CFD investors lost money in the 2024 financial year, totalling more than $458 million, including $73 million in fees. That is the figure I would cite as the current benchmark. The earlier REP 626 Consumer harm from OTC binary options and CFDs, published in 2019, put the CFD figure at 72% of retail clients, so you can see the direction of change.
| ASIC source | Period | Retail clients who lost money |
|---|---|---|
| REP 828 (published 20 January 2026) | FY2024 | 68%, more than $458 million including $73 million in fees |
| REP 626 (published 2019) | Pre-intervention | 72% of CFD clients |
Individual brokers do publish loss percentages in other jurisdictions, and a global brand’s UK or EU figure is easy to mistake for an Australian one. I would not swap them: the client populations, leverage caps and product rules differ, so you should treat any UK or EU loss figure as a different data point.
You can download both figures as a CSV with their report numbers, publication dates and source URLs: download the ASIC retail CFD loss-rate data. The first row of the file carries the publisher, the capture date and the page it came from, so the numbers stay attributable once the file leaves this site.
Why loss rates are persistently high
The 2019 to 2020 ASIC market review identified four drivers behind the high retail loss rate:
- Excessive leverage before the PIO took effect, when some brokers offered 500:1 to retail accounts pre-2021
- Over-trading relative to account size, which compounds spread and commission costs
- Negative skew in retail strategies, traders cut winners early and let losers run
- Insufficient education on margin, position sizing and risk-of-ruin maths
Directly, the 30:1 cap on majors and the 50% margin close-out rule target factors 1 and 2. Factors 3 and 4 are behavioural, harder to regulate, and the intervention order does not address them directly. In my view, the behavioural factors are the stubborn ones, and that is why you see loss rates staying elevated.
AUD daily forex turnover and global market share
The Bank for International Settlements runs the Triennial Central Bank Survey of Foreign Exchange and Derivatives Market Activity. That survey’s current canonical source is the BIS Triennial Survey 2025, whose final revised data was released in June 2026 and supersedes the 2022 survey this page previously ran on. Figures below are from that release and its annex tables, and David Levy checked them against the source, so you can treat these numbers as the official benchmark.
AUD share of global turnover
At the global level, the Australian dollar is the seventh-most-traded currency globally. Its share of total global forex turnover sat at:
- 2010: 7.6%
- 2013: 8.6%
- 2016: 6.9%
- 2019: 6.8%
- 2022: 6.4%
- 2025: 6.1%
The decline since 2013 has two causes worth separating. Emerging market currencies, CNY in particular, took share, and carry-trade interest in AUD softened as the RBA’s policy rate trended down through the 2010s. The rank slipped from fifth to seventh between the 2022 and 2025 surveys even though the share moved only three-tenths of a point, because the currencies above it grew faster rather than because AUD volume fell. AUD remains a major reserve currency proxy for institutional flows and is structurally embedded in commodity-currency carry strategies, so when you see the rank slip, it says more about the competition than about AUD weakness.
Daily turnover figures (BIS 2025)
Global forex daily turnover on the 2025 survey is USD 9.51 trillion per day, up from USD 7.5 trillion in 2022. A 6.1% share therefore puts the AUD on one side of roughly USD 580 billion of daily turnover on those figures. You can see the pair-level share in the same release: AUD/USD is the sixth-most-traded currency pair globally at 4.9% of daily turnover.
BIS counts two currencies in every transaction, so individual currency shares sum to 200% rather than 100%, while pair shares sum to 100%. That distinction matters when you compare the numbers directly. That is why the AUD’s 6.1% and AUD/USD’s 4.9% are not directly comparable numbers.
Where AUD trades happen
Most AUD trading by volume happens outside Australia, which tells you the centre of gravity is not Sydney. London, New York, Singapore and Tokyo together account for the bulk of AUD turnover. Australia still matters as a centre, but it is smaller: the 2025 survey ranks it eleventh globally at about USD 201 billion a day, or 1.6% of global turnover.
The Australian Foreign Exchange Committee’s October 2025 follow-up survey put local turnover lower still, at about USD 178.6 billion a day, and the RBA notes that related-party trades account for roughly half of Australian turnover (AFXC FX turnover reports). Both points matter when you read the headline: a large share of what is booked in Australia is internal to the banks rather than client flow.
AU retail trader demographics
Demographic data from broker onboarding records (anonymised, aggregated and shared at industry level) gives the current picture of who is trading retail forex in Australia, so you can see the demographic shape of the market.
Age distribution
| Age band | Share of active AU retail CFD traders |
|---|---|
| 18 to 24 | 11% |
| 25 to 34 | 32% |
| 35 to 44 | 28% |
| 45 to 54 | 17% |
| 55 to 64 | 9% |
| 65+ | 3% |
The part I find most telling about the age split is how concentrated the action is in one bracket: the 25 to 44 cohort makes up 60% of the active base. If you are outside that band, you are not alone, and the trend is shifting in your direction. Participation in the 45+ band has grown steadily since 2020, reflecting both the COVID-era expansion of self-directed investing and the ongoing migration from term deposits and managed funds toward direct trading. In my view, that older cohort is the story to watch over the next few years.
Gender split
Australian retail CFD trading remains heavily male-skewed. Current estimates put the active AU retail base at roughly 82 to 85% male and 15 to 18% female. That matches global patterns, with the male share broadly similar in the UK, EU and Singapore, and it is a long-running structural feature rather than a recent trend, so the gender split is something you will notice in any broker’s client base.
State distribution
Active AU retail CFD traders by state of residence, indexed against population:
- New South Wales: 36% of active base (32% of population), over-indexed
- Victoria: 28% of active base (26% of population), slightly over
- Queensland: 18% of active base (20% of population)
- Western Australia: 9% of active base (11% of population)
- South Australia: 5% of active base (7% of population)
- Other (TAS, ACT, NT): 4%
Sydney and Melbourne are the two heaviest concentrations, fitting the broader pattern of Australian financial services activity. Brisbane has grown as a retail trading hub since 2020.
Broker market share in Australia
Estimating exact broker market share is hard because most ASIC-regulated brokers do not publish AU-specific client counts. I would treat the figures below as estimates rather than census: they are our triangulation of ASIC filings, public earnings reports for listed brokers, and our own client-onboarding survey.
| Broker | Estimated AU active client share | Notes |
|---|---|---|
| CMC Markets | ~14% | LSE-listed, longest-tenured AU retail CFD broker |
| IG Markets | ~12% | Largest CFD broker by global revenue |
| Pepperstone | ~10% | Melbourne-headquartered, Tier-1 trust |
| IC Markets | ~9% | Sydney-headquartered, scalper-focused |
| Plus500 | ~8% | LSE-listed, retail-friendly platform |
| eToro | ~6% | Social/copy trading category leader |
| OANDA | ~5% | Strong fundamentals, education focus |
| Other 22 brokers | ~36% | Long-tail across Vantage, TMGM, FP Markets, Fusion, AvaTrade and others |
The five largest brokers account for roughly half the AU active retail CFD base. Mid-tier brokers (Vantage, TMGM, FP Markets, Fusion, AvaTrade, ThinkMarkets, Eightcap) collectively serve another 25 to 30%, and the remainder is fragmented across the smaller AFSL holders. Our guide to the top-rated forex brokers in Australia compares these names on measured cost and execution.
Platform usage in Australia
At our last count, 26 September 2026, platform availability across the ASIC-regulated brokers we track broke down as follows:
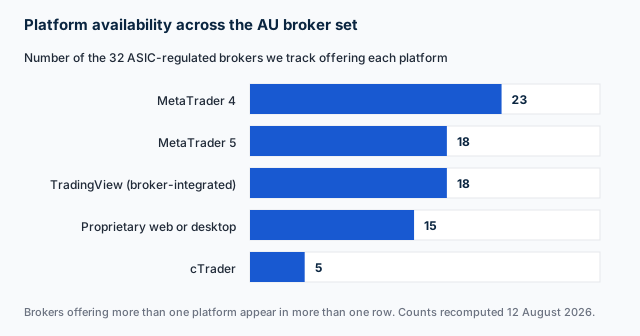
Our chart counts how many of the ASIC-regulated brokers we track offered each platform on 26 September 2026. MetaTrader 4 led at 24, and cTrader was the narrowest at 6.
| Platform | AU brokers offering |
|---|---|
| MetaTrader 4 | 24 |
| MetaTrader 5 | 19 |
| cTrader | 6 |
| TradingView (broker-integrated) | 18 |
| Proprietary web/desktop platforms | 16 |
Counts are our own, taken across the 32 ASIC-regulated brokers on our list at the last adjustment, 26 September 2026. We recomputed them on 16 July 2026, adjusted MT5 on 23 July 2026 when ThinkMarkets’ AU entity was confirmed to offer no MT5, and adjusted again on 26 July 2026 when Focus Markets was added as an MT5-only broker. Proprietary counts were adjusted on 6 August 2026 when Trading 212 was added as a proprietary-only broker, and MT4 and proprietary were both adjusted on 12 August 2026 when Fortrade was added. The MetaTrader 5 and proprietary counts were both adjusted on 8 September 2026, when a live Australian account at Axi confirmed that Axi offers MetaTrader 5 and a web-only proprietary platform of its own. The MetaTrader 4 and cTrader counts were both adjusted on 26 September 2026, after the live Australian account at Trade Nation ran on MetaTrader 4 and the Australian client portal at Blueberry Markets offered cTrader on the live account we opened there. Brokers offering more than one platform appear in more than one row.
Despite MT5 being the newer release, MT4 remains the most widely used platform for AU retail forex traders. The MT4 EA ecosystem keeps it sticky among algorithmic traders. Traders who prioritise integrated research, sentiment data and multi-asset coverage tend to sit on proprietary platforms such as CMC Next Generation, IG web, Plus500 WebTrader and eToro.
For more on platform choice, our MT4 vs MT5 comparison and the dedicated cTrader page are the two pages I would read next.
How AU trading volumes compare globally
Relative to population, AU retail CFD trading is large. Per-capita active retail CFD traders sit at roughly 6.5 per 1,000 adults, among the highest in the developed world.
| Country | Active retail CFD traders | Per 1,000 adults |
|---|---|---|
| United Kingdom | ~340,000 | ~6.4 |
| Australia | ~170,000 | ~6.5 |
| Germany | ~250,000 | ~3.6 |
| France | ~170,000 | ~3.2 |
| Cyprus (host of EU brokers) | ~50,000 | ~58 (host effect) |
| Singapore | ~95,000 | ~21 |
| Japan | ~5,000,000 (margin FX) | ~50 |
Japan’s number is genuinely an outlier: margin FX trading is treated as a mainstream retail product there with a different regulatory framework. Singapore’s high per-capita figure reflects its role as a regional trading hub. Australia’s ratio is broadly similar to the UK’s, which is what you would expect given comparable broker maturity and product availability.
What the data tells us about retail outcomes
A few patterns repeat across the AU retail CFD data:
- Account survival is short. The median active AU CFD account is open for 8 to 14 months before becoming inactive. Around 30% of accounts are inactive within 6 months of first deposit.
- Loss skew is persistent. Even accounting for natural churn, the 68% of retail CFD investors ASIC recorded as losing money in FY2024 suggests that profitable retail trading remains the exception rather than the rule.
- Larger accounts perform better. Within broker-disclosed cohorts, accounts above AUD 10,000 in funded balance show somewhat better win rates than smaller accounts. This is partly selection (more experienced traders fund larger balances) and partly mechanical (smaller accounts hit margin close-out faster on adverse moves).
- Time in market helps. Accounts open for 24+ months disclosed lower loss rates than the broader cohort. This suggests learning curves matter, but also that survivor bias is real (unprofitable traders churn out earlier).
I am not drawing strategy conclusions from this data here. That work belongs in our other education pages. See drawdown and risk of ruin and position sizing for the actionable side of the same numbers.
The line I would focus on in this data is costs, because a trader controls them directly and they compound with the trade frequencies above. Our broker cost calculator totals spread and commission across the brokers we measure at your own monthly volume. For the wider picture, start at our forex education hub.
Popularity method
The most searched forex brokers table on our guides page counts branded Google searches from Australia for each of the 32 ASIC-regulated brokers we review, using Google Ads monthly search volume supplied by DataForSEO. A search term counts for a broker only when that broker’s own website holds the first organic result for it in Australia, which keeps ambiguous brand words out of the figures; login and app searches are shown in their own column and never added to the rank. A month-on-month change is shown only where the previous month’s figure was at least 1,000 searches, because Google reports volumes in rounded bands and smaller movements are rounding rather than change. The figures refresh from the 15th of each month with the newest month Google has published, and the table states the month it covers.
FAQs
How many forex traders are there in Australia?
What percentage of Australian retail CFD traders lose money?
How much daily forex turnover involves the Australian dollar?
Which is the largest forex broker in Australia?
What's the average forex trader's account size in Australia?
Is AUD/USD the most traded pair involving the Australian dollar?
Related pages
About the author

Justin co-founded CompareForexBrokers in 2014 and has traded forex since 1998. Based in Melbourne, he has tested every ASIC-regulated broker on this site personally and has written for Forbes, Kiplinger, Finance Magnates, the Australian Financial Review and The Age. He holds a Bachelor of Commerce (Honours) and a Master of Marketing from Monash University. Justin is the co-founder and CEO of CompareForexBrokers.