
The top bearish patterns at a glance
- Head and shoulders, three peaks, the middle highest. Reversal at the top of an uptrend.
- Double top, twin highs with a trough between. Reversal pattern.
- Rising wedge, converging lines tilting up. Often a reversal in an uptrend.
- Descending triangle, flat support, falling resistance. Continuation in a downtrend.
- Bear flag, sharp drop, tight pullback up, breakout lower. Continuation pattern.
- Three black crows, three consecutive long bearish candles. Reversal signal.
All six work on the major AUD pairs, and they are clearest on the 1-hour and 4-hour timeframes. For broader context, see our chart patterns pillar.
The six bearish patterns in detail
Head and shoulders
Three peaks at the top of an uptrend define the pattern. The middle peak (the head) is the highest, and the two outer peaks (the shoulders) sit at similar but not identical heights. A neckline runs across the two troughs between the peaks. Volume often declines through the right shoulder, signalling fading buying interest, and that is the detail to watch for first.
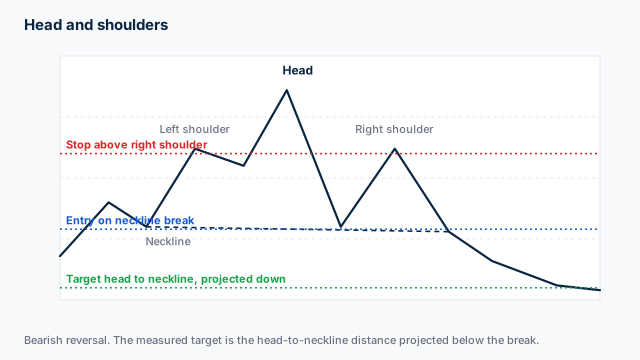
The diagram below shows the left shoulder, the higher head, the right shoulder and the neckline. The target is measured from the head down to the neckline and projected below the break.
Entry is short on a close below the neckline. Many traders wait for a retest of the broken neckline (now resistance) before entering, and I would too. The retest gives you a tighter stop and a better risk-to-reward.
Measure from the head’s high down to the neckline and project that distance below the neckline break. So a 200-pip head height yields a 200-pip target on AUD/USD.
The classic error is calling the top before the neckline breaks. Until the neckline gives way, the pattern is not confirmed. Aggressive shorts at the right shoulder fail far more often than disciplined neckline-break entries, and that is a lesson I would rather you learn from this page than from a live account.
Double top
Price rallies to a high, pulls back, rallies again to roughly the same high, then rolls over. The two highs form an “M” shape with a trough between them (the neckline). Volume usually drops on the second high, signalling buyer exhaustion, and that is your cue to get ready.
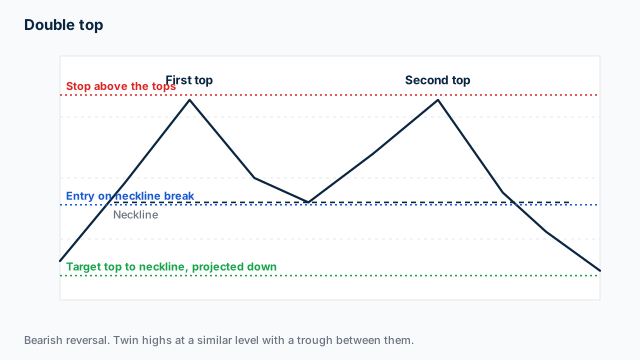
The diagram shows the two highs, the neckline across the trough between them, and where the entry, stop and target are placed, measured from the top to the neckline and projected down.
Entry is short on a close below the neckline, which is the low point between the two highs. Entering at the second touch of the high, before neckline confirmation, is aggressive and prone to failure. I would wait for the break.
Measure from the highest high down to the neckline and project that distance below the neckline break. A 120-pip M on EUR/USD yields a 120-pip target.
The mistake I see most is confusing a double top with a sideways range at the top of an uptrend. A real double top has a meaningful pullback between the two highs and a clear neckline break. If the neckline never breaks, you do not have a pattern.
Rising wedge
Price prints higher highs and higher lows, but the lows are rising faster than the highs, so the two trendlines converge upward. Volume usually fades through the wedge as buying pressure exhausts. A rising wedge inside an uptrend is a reversal signal; inside a downtrend, it is often a continuation pattern. Context determines which reading applies.
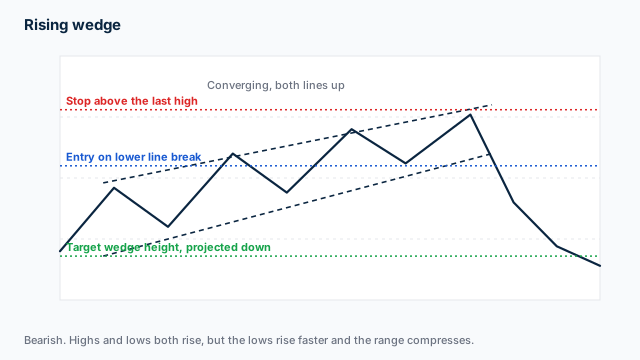
The diagram shows the two converging upward trendlines, and where you place your entry, stop and wedge-height target once the lower line breaks.
Entry is short on a close below the lower trendline. The breakdown is often sharp because the wedge represents a compression that releases when broken, so do not wait for a retest.
Measure the height of the wedge at its widest point and project that distance below the breakdown. The prior swing low is a common secondary target you can use to scale out.
The mistake is trading rising wedges that have not fully formed. A wedge needs at least two clean touches on each side before it is tradeable, and I would want three or more touches per side to strengthen the signal before risking capital.
Descending triangle
A flat line of support sits across multiple touches at the bottom, while price makes lower highs above. The two lines converge on the right edge. Sellers are pressing aggressively, buyers are defending one specific level, and the contest usually resolves with a breakdown below support. That is the moment you are waiting for.
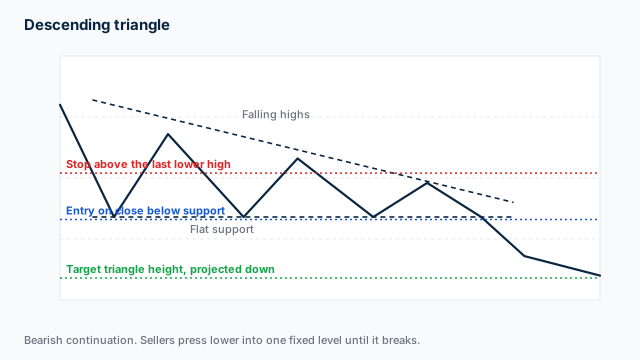
The diagram shows the flat support line, the falling highs above it, and where the entry, stop and measured target sit after the break below support.
Entry is short on the close of a candle below the flat support line. Some traders wait for a retest of the broken support before entering. The retest entry gives a better risk-to-reward but skips the fastest moves, so I would decide based on how much slippage you can tolerate.
Measure the height of the triangle, from the first lower high to the support line, and project that distance down from the breakdown point. That is the measured target.
The mistake is trading the pattern against the higher-timeframe trend. Descending triangles are continuation patterns, so they work best when the daily or weekly chart is already pointing down. Trading them against that trend means you are fighting the current.
Bear flag
Price drops sharply, forming the flagpole, then pulls back in a tight, slightly upward-sloping channel, the flag. The pullback is shallow, usually retracing less than 50% of the flagpole. That shallow retracement is what you want to see before acting.
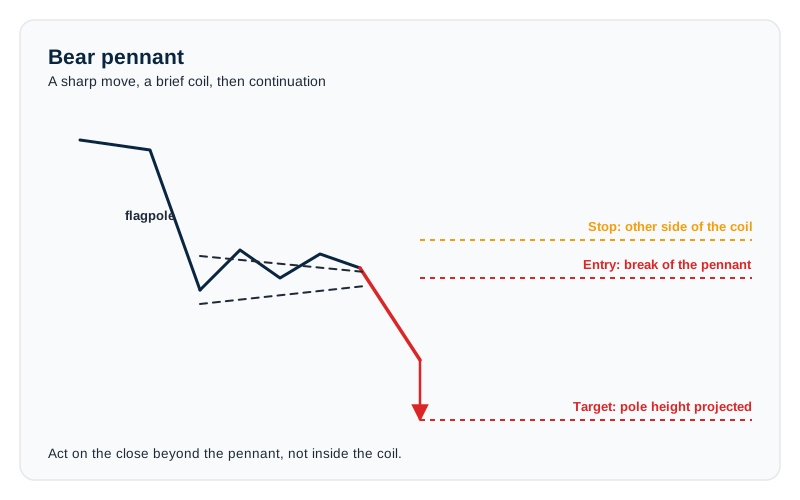
Mirroring the bull version on the way down, the bear pennant coils into a small symmetrical triangle instead of drifting up a channel. The diagram marks the flagpole, the coil and the levels. Formation: a steep fall, then converging trendlines forming a tight triangle. Confirmation: a close below the coil’s lower trendline. Invalidation: a close above the coil’s high, or a coil that outlasts the flagpole. Sizing: the same AUD 100 of risk on a 40-pip stop, at roughly AUD 1.50 a pip on a mini lot, sizes near 1.7 mini lots, so the wider stop buys a smaller position, a discipline that keeps you in the game when the pattern fails.
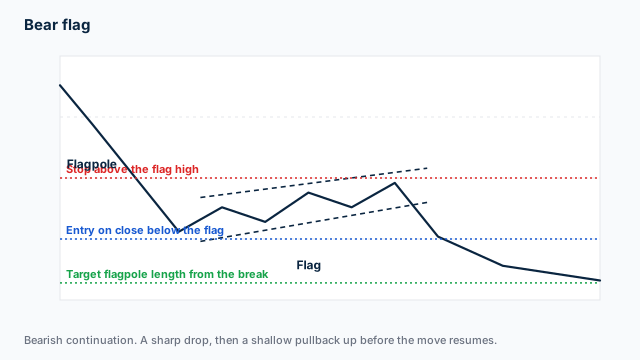
The diagram shows the flagpole drop, the tight pullback channel, and where the entry, stop and target are placed, measured as the flagpole length projected from the break.
Entry is short on a close below the lower trendline of the flag. Aggressive traders enter on the first lower high inside the flag, but I would stick to the confirmed break.
Measure the length of the flagpole and project it down from the breakdown. Bear flags produce some of the cleanest targets in pattern trading because the geometry is simple.
The mistake is trading flags that lasted too long. A real bear flag forms over a small fraction of the time the flagpole took. If the pullback drags on for longer than the drop, it is a different pattern, and I would step aside.
Three black crows
Three consecutive long bearish candles appear, each closing lower than the prior, each opening within the prior candle’s body. The pattern signals a rapid shift in sentiment, usually after an uptrend or consolidation. Three black crows is a candlestick pattern rather than a chart pattern in the geometric sense, but it carries similar weight when it appears at a meaningful structural level, and it is treated the same way.
Short entry is taken on the close of the third candle, or on a small pullback to the close of candle two. Confirmation from a break of nearby support strengthens the signal, and I would want that extra confirmation before you commit.
Targets are less precise than with geometric patterns. Use the prior swing low or a measured-move equal to the height of the three candles combined. That is the practical limit.
The mistake is trading three black crows that follow an exhausted move lower. The pattern works as a reversal at a high. After an extended decline, three more bearish candles often signal exhaustion rather than continuation, so you are better off waiting for a bounce.
How to confirm a bearish pattern
A clean shape isn’t enough on its own. Three confirmation tools sharpen the signal.
Volume. Bearish breakdowns on rising volume have a much higher follow-through rate than breakdowns on quiet volume. Forex does not have centralised exchange volume, but tick volume from a broker’s MT4, MT5 or cTrader feed is a usable proxy. Pepperstone, IC Markets and FP Markets all expose tick volume natively, and our analysts include all three in our highest-rated forex brokers in Australia guide.
RSI. A bearish pattern that prints with the 14-period RSI rolling out of overbought territory (above 70) has a stronger directional case than one that prints with RSI already oversold. RSI divergence, where price makes a higher high while RSI makes a lower high, is a classic confirmation for double tops and head-and-shoulders, and it is always worth checking.
MACD divergence. When you spot a bearish pattern at an uptrend top with MACD histogram bars getting smaller (bearish divergence against price), it carries more weight. The MACD signal-line cross below the zero line near the breakdown adds another confirmation layer.
Not all three are needed. One or two confirming signals beyond the pattern itself is usually enough. Stack too many filters and a trade will never be taken. I would rather you take a good trade with two confirmations than wait for a perfect setup that never comes.
Risk management for bearish patterns
Stop placement
The stop on every bearish pattern goes above the pattern’s highest point.
- Descending triangle / bear flag, above the highest lower high inside the pattern.
- Double top, above the highest of the two tops, with a few pips of buffer for spread and noise.
- Rising wedge, above the upper trendline of the wedge.
- Head and shoulders, above the head’s high. Aggressive traders place the stop above the right shoulder, accepting that a deeper move into the head invalidates the trade earlier.
Never place a stop based purely on a fixed pip distance that ignores the pattern. The pattern defines invalidation. If the pattern’s structure is broken, your trade thesis is broken, and the stop should reflect that. That is the rule.
Position sizing under the ASIC cap
ASIC’s Product Intervention Order caps Australian retail traders at 30:1 leverage on major forex pairs (in force since 29 March 2021, extended to 23 May 2027). On AUD/JPY, that means each AUD 1 of margin controls AUD 30 of position. The caps on gold, indices, shares and crypto sit in our ASIC forex regulation guide. ASIC brokers must also be members of AFCA, which gives you free access to dispute resolution if anything goes wrong.
Here is a worked example for an account: AUD 5,000 balance, 1% risk per trade (AUD 50), bearish pattern on AUD/JPY with a 60-pip stop above the pattern high.
- Risk per trade: AUD 50
- Stop distance: 60 pips
- Position size: AUD 50 / 60 pips = AUD 0.83 per pip = roughly 0.08 standard lot (8,000 units)
- Margin required at maximum leverage: around AUD 220
- Reward target at 2:1 RR: 120 pips = AUD 100 if the pattern resolves to target
Sizing this way keeps any single failed pattern at 1% of the account. Gold (XAU/USD) trades at 20:1 retail leverage under ASIC, below the major-pair cap, so position sizing maths shift if you apply these patterns to a gold chart. Adjust the margin calculation accordingly. I would keep a separate note for gold setups.
ASIC also mandates negative balance protection and margin close-out at 50% of initial margin. But risk management starts with the stop, not the safety net. That is the part you control.
Our position size calculator runs that same arithmetic for any balance, risk percentage and stop distance, so you can size your trades in seconds.
For the other side of the setup, work through our bullish chart patterns for Australian traders and harmonic chart patterns for Australian traders guides. For trading these patterns from an annotated chart, our guide to the best TradingView brokers in Australia covers which AU brokers route orders from TradingView. For the wider picture, start at our forex education hub.
FAQs
What's the most reliable bearish pattern in forex?
Why do bearish patterns sometimes fail spectacularly in forex?
Are bearish patterns easier to trade than bullish patterns?
Should I trade bearish patterns on AUD/USD?
Related pages
About the author

Justin co-founded CompareForexBrokers in 2014 and has traded forex since 1998. Based in Melbourne, he has tested every ASIC-regulated broker on this site personally and has written for Forbes, Kiplinger, Finance Magnates, the Australian Financial Review and The Age. He holds a Bachelor of Commerce (Honours) and a Master of Marketing from Monash University. Justin is the co-founder and CEO of CompareForexBrokers.