
Summary
- Chart patterns are recurring shapes in price action that traders use to map probable next moves.
- They aren’t predictive in any statistical sense. They’re a framework for defining entry, stop and target.
- Three main families: bullish (continuation or reversal up), bearish (continuation or reversal down), and harmonic (Fibonacci-based geometric setups).
- For Australian retail traders working under ASIC’s leverage limits, patterns are most useful for tightening stops and sizing risk, not chasing direction.
- Most ASIC brokers ship Autochartist, Trading Central or a built-in pattern scanner. Pepperstone, IC Markets, FP Markets and Eightcap include Autochartist free. CMC’s Next Generation has its own pattern recognition module.
What is a chart pattern?
On a forex chart, a pattern is a recognisable shape that price draws over time, built from the highs, lows, opens and closes of each bar or candle. Some take a few hours to print on a 5-minute chart; others form over months on a daily or weekly timeframe, and I’d say the pattern’s timeframe must match the holding period, otherwise the signal is useless.
Pattern trading sits inside the broader field of technical analysis. The premise is simple: price action repeats often enough that recognising the shape early gives a usable edge. Whether that edge is real or imagined is debated. What’s not debated is that millions of traders watch the same patterns, and I’d argue that self-fulfilling action is a big reason why setups like the head and shoulders or the double top still matter in 2026.
Candle, bar and line charts as the building blocks
Patterns are drawn on price charts. Three chart types dominate AU broker platforms.
- Candlestick charts show open, high, low and close in a single bar with a body and wicks. This is the default for most patterns and the standard view in MT4, MT5, cTrader, TradingView and CMC’s Next Generation.
- Bar charts (OHLC) show the same data with vertical lines and small ticks. Functionally similar to candles, less visually intuitive.
- Line charts plot only the closing price as a continuous line. Useful for spotting long-term structure but stripped of the intra-period detail that powers candle patterns.
Start on candles if you’re new to chart reading, because the patterns in this guide assume a candle view.
Timeframes and pattern reliability
Higher-timeframe patterns carry more weight than the same pattern on lower timeframes. A double bottom on the daily AUD/USD chart is a stronger signal than a double bottom on the 5-minute chart. The reason is liquidity: more participants act on higher-timeframe levels, meaning more capital is positioned around the pattern’s break point, so the move that follows is less likely to reverse on you after entry.
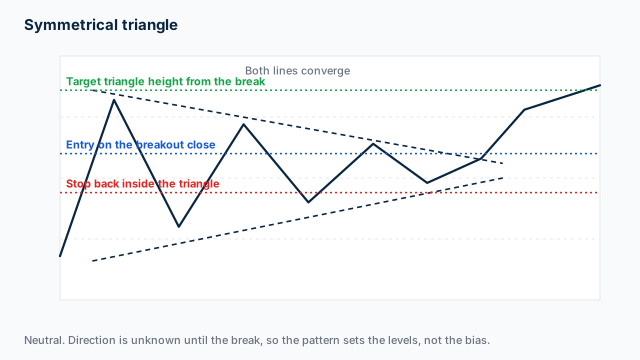
The diagram shows price compressing between two converging trendlines. The entry is taken on the breakout close, the stop placed back inside the triangle and the target measured as the triangle height projected from the break. I’d ask whether the projected target gives at least twice your risk before the next resistance level.
For Australian traders, the 1-hour and 4-hour charts strike a workable balance between signal quality and trade frequency if you’re active around the Sydney session open (around 7am AEDT) or the London/New York overlap (8pm to 1am AEDT). A pattern that completes outside trading hours still requires someone awake to manage the entry and stop, which is a real constraint on setups that trigger at 3am.
The three pattern families
Pattern catalogues group setups in different ways. I think the clearest split for traders is by direction and structure: bullish (signal up), bearish (signal down), and harmonic (Fibonacci-based geometric structures that can resolve either way). That split lets a trader filter straight to the setups that match your existing directional view.
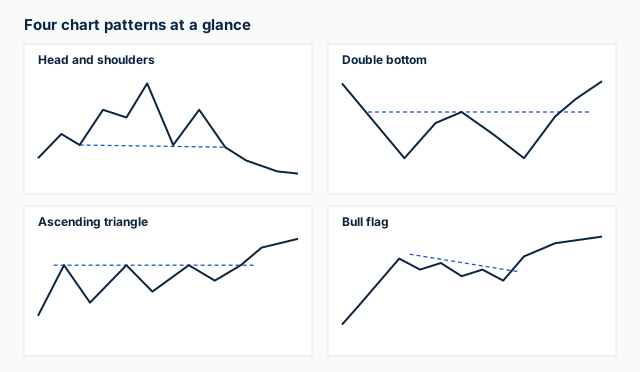
Four of the most common setups are shown together in the diagram: a head and shoulders reversal, a double bottom reversal, an ascending triangle continuation and a bull flag continuation. Each has the line that defines its break, and spotting which family a pattern belongs to before the break happens is what turns a chart annotation into a trade you can actually place.
Each family gets its own dedicated guide on this site, and the summaries below preview the most-watched patterns in each.
Bullish patterns
A bullish pattern suggests price is more likely to move up than down once it completes, but where it appears changes the trade. At the bottom of downtrends it forms a reversal pattern, which carries a lower strike rate than continuations and typically offers a larger target relative to the stop; as a pause inside an existing uptrend it forms a continuation pattern.
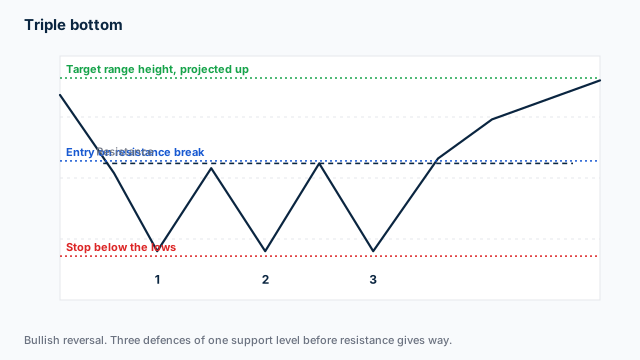
The diagram shows price holding one support level three times before resistance breaks. The entry is on that break, the stop below the lows and the target measured as the range height projected up. The three-touch count provides a concrete rule rather than a subjective read, which matters when you are deciding whether the pattern is worth the margin commitment.
The five most-traded bullish setups:
- Ascending triangle, flat resistance, rising support. Continuation pattern in an uptrend.
- Double bottom, two touches of a low with a peak between. Reversal pattern at the end of a downtrend.
- Cup and handle, rounded bottom followed by a small pullback. Continuation pattern.
- Falling wedge, converging trendlines tilting down. Often a reversal in a downtrend.
- Bull flag, sharp rally followed by a tight pullback. Continuation pattern.
The bullish chart patterns guide covers full anatomy, signal logic, target measurement and common mistakes for each.
Bearish patterns
Bearish patterns suggest price is more likely to fall than rise once they complete, but where they appear changes the trade plan. At the top of uptrends they form reversal patterns, and bearish reversals at market tops tend to resolve faster than bullish reversals at bottoms, so your target may be hit in fewer sessions; as pauses inside an existing downtrend they form continuation patterns.
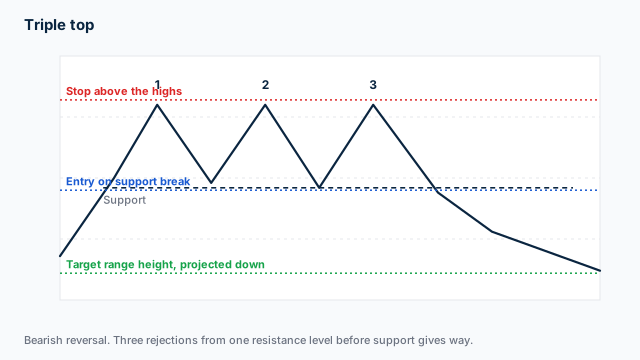
The diagram shows price rejected three times from one resistance level before support gives way. The entry is on the support break, the stop above the highs and the target measured as the range height projected down. I’d say that third rejection is the signal you are watching for, because entering before the break exposes a trader to a false setup that traps them on the wrong side of the range.
The five most-traded bearish setups:
- Head and shoulders, three peaks, the middle highest. Reversal at the top of an uptrend.
- Double top, two touches of a high with a trough between. Reversal pattern.
- Rising wedge, converging trendlines tilting up. Often a reversal in an uptrend.
- Descending triangle, flat support, falling resistance. Continuation in a downtrend.
- Bear flag, sharp fall followed by a tight pullback. Continuation pattern.
For full breakdowns see the bearish chart patterns guide.
Harmonic patterns
Harmonic patterns are geometric setups defined by specific Fibonacci ratios between five points (X, A, B, C, D). They’re more technical than the classical patterns and require precise measurement, but I find the entry, stop and target are unusually well-defined when the structure prints cleanly. That precision removes the guesswork from your trade management, because the pattern itself dictates all three levels.
The most-traded harmonic patterns:
- Gartley, 0.618 retrace from X to A, B at 0.618 of XA, D at 0.786 of XA.
- Bat, D at 0.886 of XA. Tighter, deeper retrace than Gartley.
- Butterfly, D extends beyond X, typically to 1.27 or 1.618.
- Crab, D at 1.618 extension of XA. The deepest extension in the family.
- Cypher, distinct ratios with C at 1.272 to 1.414 of XA.
- Shark, newer pattern with C extended to 1.13 of XA.
For full Fibonacci ratios, anatomy and target maths see the harmonic chart patterns guide.
How to use chart patterns in Australian forex trading
Chart patterns are a tool, not a strategy. I’d argue the value comes from how you use them inside a complete trading plan that respects ASIC’s retail rules. Without a plan that sets the session, the pattern shortlist and the position size before the setup appears, a trader is reacting rather than executing, and that is where the losses accumulate.
Patterns under ASIC’s leverage cap
ASIC’s 30:1 leverage cap on major forex pairs under the Product Intervention Order (in force since 29 March 2021, extended to 23 May 2027) means a position size on AUD/USD that’s roughly 3.3 times your margin, not the 100:1 or 500:1 some offshore brokers offer. That cap directly limits how many concurrent pattern setups can be carried without over-concentrating the account.
What this means for pattern traders:
- Smaller positions mean each trade is less catastrophic, but it also means stops have to be honest. A double-bottom buy with a stop 80 pips below the low is a real 80 pips of risk, not a 5-pip nick that gets bailed out by leverage.
- Pattern target maths matter more. If you’re risking 50 pips for a 100-pip target, your reward-to-risk is 2:1. That’s the kind of ratio that survives a 40% strike rate. Patterns with sloppy or undefined targets don’t.
- Tighter stops below pattern lows or above pattern highs let you size up within ASIC’s leverage limits while keeping risk-per-trade at 1% or 2% of account.
The cap an instrument falls under changes the position size available from a given pattern signal, so you need to check the tier before sizing the trade. The PIO also sets lower caps on gold, indices, share CFDs and crypto, and the full tier list is in our ASIC leverage caps guide.
Trading XAU/USD chart patterns means working under the 20:1 gold cap, so size your risk accordingly.
AUD pair context
AUD/USD, AUD/JPY, AUD/NZD and AUD/CAD all show clean technical structure thanks to deep Sydney-session liquidity around the 7am AEDT open. I’d say AUD/USD is the most pattern-friendly major for Australian traders because:
- It’s a major under ASIC, so the top retail leverage tier applies
- Spreads are tight at every ASIC broker (typically 0.1 to 0.7 pips on RAW or commission accounts); our lowest spread forex brokers guide tracks the tested figures
- It moves in clean technical waves driven by RBA policy, Chinese data and US dollar trend
- Daily ranges are usually 50 to 100 pips, which is enough to make pattern targets meaningful
AUD/JPY is the more volatile pattern pair. Daily ranges run 80 to 150 pips and the pair responds aggressively to risk-on / risk-off shifts. I’d call it good for swing traders, but less forgiving for newer traders learning pattern recognition, because the wider stop distances force a smaller position size for the same dollar risk.
Patterns are not predictions
This is the rule that catches every new pattern trader. A textbook head and shoulders that prints on the 4-hour AUD/USD chart isn’t a guarantee of anything. It’s a setup that gives a defined entry, a defined stop, and a defined target. The pattern is just a framework; whether the trade works is a separate question, and accepting that separation is what stops you from doubling down on a failed setup.
Pattern strike rates in academic studies range from 50% to 70% depending on the pattern, the timeframe and the market. I’d argue the edge isn’t the pattern itself; it’s the combination of sensible position sizing, a stop placed where the pattern would be invalidated, and a target that produces an asymmetric reward. Frame it that way and a 50% strike rate can still produce a positive expectancy for your account.
Tools that auto-detect chart patterns
Most Australian retail traders don’t draw patterns by hand. The major ASIC brokers our team tracks ship pattern-detection tools that scan multiple timeframes and instruments automatically. Scanner access is worth weighing when you compare the top-rated forex brokers in Australia, because the tool directly affects how many viable setups appear in a session.
Autochartist
Across the brokers our team covers, Autochartist is the most widely deployed pattern scanner. It identifies classical patterns (triangles, flags, head and shoulders, double tops/bottoms) and Fibonacci-based patterns (Gartley, Bat, Butterfly) across forex, indices, commodities and crypto in real time. Each detected pattern shows a quality score, a probability of breakout, and a measured target, which gives you a ranked watchlist instead of a hundred unprioritised signals.
Autochartist is included free with these ASIC brokers:
- Pepperstone, Autochartist on MT4, MT5 and cTrader
- IC Markets, Autochartist on MT4, MT5 and cTrader
- FP Markets, Autochartist on MT4, MT5 and cTrader
- Eightcap, Autochartist on MT4, MT5
It’s free for clients with funded accounts. Some brokers throw in the Autochartist mobile app for $0 too.
Trading Central
Trading Central is the second major scanner. The detection engine is similar to Autochartist, but I’d say the analyst commentary is heavier, with daily technical reports written by in-house analysts. OANDA and IG offer Trading Central on AU accounts. Vantage and FXCM include access on certain account tiers. The commentary layer is the differentiator: it tells you why the pattern matters now, not just that it appeared.
CMC Next Generation Pattern Recognition Scanner
CMC Markets’s Next Generation platform has its own built-in scanner that detects 70+ chart patterns across the full 12,000-instrument universe. The scanner is deeply integrated with the rest of Next Generation, so clicking a detected pattern jumps straight to a pre-loaded chart with the pattern annotated. That single-click path from detection to annotated chart saves you the friction of redrawing the setup before assessing it. See the CMC Markets review for full coverage.
TradingView pattern detection
TradingView’s premium tiers include automatic pattern detection through community indicators and a built-in “Auto Patterns” feature. I’d say the AU brokers that integrate TradingView (Pepperstone, OANDA, FP Markets, Eightcap, Vantage, Capital.com) let you trade directly from TradingView charts, so detection and execution stay in one window rather than forcing a switch. Our guide to the best TradingView brokers in Australia has the full broker list and how each integration works.
MT4 / MT5 community indicators
Both MetaTrader platforms have a deep ecosystem of free and paid pattern-detection indicators. Quality varies. I’d say the free options bundled with most ASIC brokers’ MT4/MT5 builds are a useful starting point but rarely match Autochartist or Trading Central for accuracy. The gap matters when a missed detection or a false signal costs you a trade that a better scanner would have caught or filtered.
Common pattern-trading mistakes
Five mistakes account for most of the losses we see in pattern-based trading.
Trading patterns in isolation. A clean ascending triangle on a 1-minute chart against a strong daily downtrend is a low-probability setup. I’d argue that pattern traders who succeed almost always confirm the higher-timeframe context first, then trade in the direction of the higher-timeframe trend. Skipping that step means your entry is fighting the dominant flow, which erodes the edge before the trade even opens.
Forcing the pattern. When the pattern requires squinting, it isn’t there. Real patterns have clean, obvious touches and a clear structure. The pattern recognition scanners help here because they apply consistent rules, and that consistency protects you from talking yourself into a setup that the market has not actually printed.
Skipping volume confirmation. A double bottom that prints on declining volume is suspect. A breakout from a triangle on a quiet bar usually fails. Volume isn’t perfect on FX (where there’s no centralised exchange volume) but tick volume from your broker’s MT4/MT5 feed is a usable proxy, and ignoring it means taking breakouts that lack the participation needed to follow through.
Stop placement that ignores the pattern. The stop on a bullish pattern goes below the pattern’s low. The stop on a bearish pattern goes above the pattern’s high. I’d always place the stop where the pattern invalidates, because arbitrary fixed pip distances ignore what the pattern is telling about invalidation and leave you exposed to getting stopped out on noise while the setup is still intact.
Over-leveraging. Even with the ASIC cap, it’s easy to size up to where a single failed pattern wipes out a week of gains. I’d stick to risking no more than 2% of account on any single setup; risking more is a fast way to bust an account, regardless of pattern quality. Because the stop belongs at the pattern’s invalidation point rather than at a round number, the position size has to follow the stop: our position size calculator does that conversion for you so the risk per trade stays fixed.
I’d begin with the direction you already trade most. Our page on bullish chart patterns for Australian traders covers the continuation and reversal setups that print in an uptrend, with the entry, stop and target rules for each. For the wider picture beyond charting, work through our forex education hub, which structures the material so the material can be followed in sequence rather than jumping between topics.
FAQs
Are chart patterns reliable for forex trading?
Which chart patterns work best on AUD/USD?
What's the best free pattern scanner for Australian traders?
Do harmonic patterns actually work?
Can I rely on pattern alerts from my broker's platform?
How does ASIC's leverage cap change pattern trading in Australia?
Related pages
About the author

Justin co-founded CompareForexBrokers in 2014 and has traded forex since 1998. Based in Melbourne, he has tested every ASIC-regulated broker on this site personally and has written for Forbes, Kiplinger, Finance Magnates, the Australian Financial Review and The Age. He holds a Bachelor of Commerce (Honours) and a Master of Marketing from Monash University. Justin is the co-founder and CEO of CompareForexBrokers.