
What makes a harmonic pattern
- Harmonic patterns are five-point geometric structures (X, A, B, C, D) defined by specific Fibonacci retracement and extension ratios.
- They give the cleanest entry, stop and target maths in pattern trading because every leg has a measured ratio.
- Seven patterns dominate AU charts: Gartley, Bat, Butterfly, Crab, Cypher, Shark and ABCD.
- Used as either bullish or bearish setups depending on which direction the structure resolves at point D (the entry).
- Most easily detected with Autochartist or a dedicated harmonic indicator on MT4, MT5 or TradingView.
For the wider context on chart pattern families, see the chart patterns pillar.
How harmonic patterns work
Every harmonic pattern starts at point X, moves to A, retraces to B, swings to C, then completes the structure at D. The ratios between these points are what separate one harmonic from another, and they are what you need to measure before the setup means anything, which is a step I would call the foundation of the whole trade.
The two Fibonacci numbers you will rely on most are 0.618 (the golden ratio retracement) and 1.618 (the inverse, used as an extension), and I would call them the backbone of harmonic geometry. Other ratios (0.382, 0.5, 0.786, 0.886, 1.13, 1.27, 1.414, 2.0, 2.24, 3.14) appear at specific points in specific patterns.
Point D is where you enter the trade, and I would take the position in the opposite direction of the C-to-D leg, expecting price to reverse from D back toward C and beyond. The stop goes a small distance beyond D. First target is usually 0.382 of the AD leg. Second target is 0.618 of the AD leg.
A harmonic pattern can be bullish or bearish: when price moves down to D, the trade is long; when price moves up to D, the trade is short. The geometry is identical, so your only task is to read the direction correctly.
The seven harmonic patterns
Gartley
The original harmonic, named for H.M. Gartley’s 1935 book “Profits in the Stock Market”.
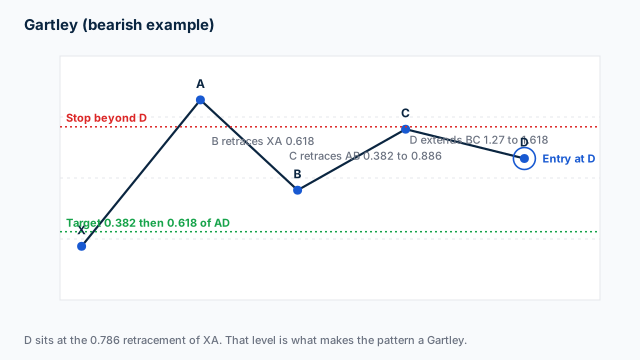
This diagram shows the five points and the ratio each leg must hit, so you can read the entry at D, the stop just beyond it and the two targets measured along the AD leg, which I would call the clearest presentation.
Fibonacci ratios:
- B retraces XA at 0.618
- C retraces AB between 0.382 and 0.886
- D extends BC between 1.27 and 1.618
- D retraces XA at 0.786
Entry is long (or short) at point D, opposite the CD leg. Place your stop a small distance beyond D, typically at the 1.0 retracement of XA, which would invalidate the pattern. First target sits at 0.382 of AD. Second target sits at 0.618 of AD.
The mistake I would flag first is trading “almost” Gartleys where D doesn’t hit the 0.786 retrace. The 0.786 level is what makes the Gartley what it is, and loose ratios produce loose results.
Bat
Developed by Scott Carney in 2001. Tighter than the Gartley.
Fibonacci ratios:
- B retraces XA between 0.382 and 0.5
- C retraces AB between 0.382 and 0.886
- D extends BC between 1.618 and 2.618
- D retraces XA at 0.886
D sits at the deeper 0.886 retrace of XA in a Bat, with entry at D, stop just beyond and targets at 0.382 then 0.618 of AD. That deeper D level often gives you a tighter stop and a better risk-to-reward than the Gartley.
Confusing a Bat with a Gartley is the common slip. The B retrace is the key tell: 0.382 to 0.5 means Bat, and 0.618 means Gartley. Mislabel the pattern and you’ll project the wrong D level.
Butterfly
Identified by Bryce Gilmore. Distinguished by D extending beyond X.
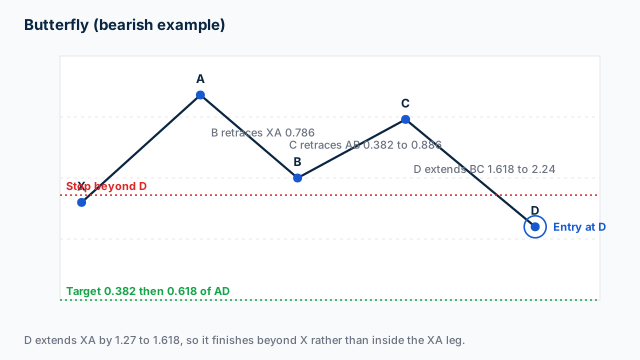
The diagram shows the same five-point structure with D extending beyond X, and it marks where your entry, stop and the two AD targets fall.
Fibonacci ratios:
- B retraces XA at 0.786
- C retraces AB between 0.382 and 0.886
- D extends BC between 1.618 and 2.24
- D extends XA between 1.27 and 1.618 (D is beyond X)
Entry is at D, but unlike the Gartley and Bat, D is past the original X point. That makes the Butterfly a stretch pattern, often appearing at the end of an extended move. Stop placement sits just beyond D, and your targets sit at 0.382 and 0.618 of AD as standard.
The mistake here is treating a Butterfly like a reversal pattern at “any” exhausted level. What makes it a Butterfly is the XA extension at D. Without the right ratio, you are just looking at a price move that has gone too far.
Crab
Also developed by Scott Carney. Has the deepest D extension in the harmonic family.
Fibonacci ratios:
- B retraces XA between 0.382 and 0.618
- C retraces AB between 0.382 and 0.886
- D extends BC between 2.618 and 3.618
- D extends XA at 1.618
D sits at a 1.618 extension of XA, well beyond X, with entry at D and stop just beyond. I favour the Crab for its precise D level, since 1.618 is one of the most-watched Fibonacci extensions, and for the strong reaction price often shows at this point.
The sizing mistake here is placing your stop too tight. Crabs often print after fast moves and the volatility around D can spike a stop placed too close. Give the pattern a small buffer beyond the 1.618 level.
Cypher
A more recent addition to the harmonic family, developed by Darren Oglesbee.
Fibonacci ratios:
- B retraces XA between 0.382 and 0.618
- C extends XA between 1.272 and 1.414 (C is beyond A)
- D retraces XC at 0.786
Unusually, C extends beyond A in a Cypher rather than retracing AB, so D is measured off the XC leg, not the XA leg. Entry is at D, the stop just beyond, with targets at the 0.382 and 0.618 retracement of CD.
Drawing the legs incorrectly is the typical Cypher mistake. Because C extends beyond A, traders new to Cyphers often misidentify the pattern as a failed Bat or Gartley. The C-to-XA ratio is the tell, and I would start there.
Shark
The newest of the major harmonics, also developed by Carney around 2011.
Fibonacci ratios:
- Uses points 0, X, A, B, C (different labelling)
- B retraces XA between 1.13 and 1.618
- C extends XA between 1.13 and 1.414
- The pattern often transitions into a 5-0 pattern after completion
Entry is at C, with your stop beyond. I would call the Shark more aggressive than the older harmonics, and it often suits traders looking for short-duration reversals at extreme levels.
The misstep here is mistaking the Shark for a Crab or Butterfly. What makes the Shark distinctive is B extending beyond X (rather than retracing inside XA), which is rare in the older harmonics.
ABCD
ABCD is the simplest harmonic structure, often used as a building block inside the larger five-point patterns.
Fibonacci ratios:
- AB and CD legs are equal in length and time
- BC retraces AB between 0.618 and 0.786
- CD extends BC between 1.27 and 1.618
Entry is at D, opposite the direction of CD. The ABCD is the easiest harmonic to spot and the easiest to trade, but the geometry is simpler than the five-point patterns and your strike rate is correspondingly lower without strong context.
The temptation is trading every ABCD that prints. Without higher-timeframe trend confirmation, the ABCD’s strike rate isn’t compelling, so I would treat it as a confluence tool inside larger structures rather than a standalone signal.
How to confirm a harmonic pattern
Because harmonic patterns are stricter than classical patterns, confirmation matters less mechanically and more about context.
Higher-timeframe trend. A bullish Gartley on the 4-hour AUD/USD chart works much better when the daily chart is in a clean uptrend. If you trade harmonics against a strong higher-timeframe trend, the strike rate falls sharply.
Fibonacci confluence. When the D point of a harmonic lines up with another Fibonacci level (a major retracement, a previous swing high or low, a round number), the pattern carries more weight. You will see AUD/USD print high-quality harmonics at the 0.7000 round number more often than at random levels.
Candlestick confirmation at D. A bullish Gartley with a hammer or bullish engulfing candle at D is stronger than one that completes on a doji. The candle action at the entry point is your real-time read on whether the reversal is taking hold.
Auto-detection. Autochartist and most TradingView harmonic indicators flag completed harmonics in real time. The AU brokers our team tracks, including Pepperstone, IC Markets, FP Markets and Eightcap, include Autochartist free with funded accounts, and each appears in our leading Australian forex brokers guide. CMC Markets’s Next Generation has its own pattern recognition module that includes the major harmonic patterns.
Risk management for harmonic patterns
Stop placement
You place the stop on a harmonic pattern just beyond point D. The exact distance depends on the pattern:
- Gartley, beyond the 1.0 XA retracement
- Bat, beyond the 1.0 XA retracement
- Butterfly, beyond the 1.618 XA extension
- Crab, beyond the 1.618 XA extension (with a small buffer for volatility)
- Cypher, beyond the 1.0 XC retracement
- Shark, beyond the 1.414 XA extension
- ABCD, beyond the 1.27 to 1.618 BC extension
The stop is small relative to the AD target distance, which is why harmonic patterns often produce risk-to-reward ratios of 3:1 or higher. In my view, that asymmetric reward profile is the structural advantage of harmonic trading. Even at strike rates of 50%, the maths work.
Position sizing under the ASIC cap
Your Australian retail account is capped at 30:1 leverage on major forex pairs under ASIC’s Product Intervention Order (in force since 29 March 2021, extended to 23 May 2027). The caps on gold, indices, shares and crypto sit in our guide to ASIC regulation. ASIC also requires brokers to be members of AFCA, which provides free dispute resolution to retail clients if anything goes wrong.
Take a worked example: an AUD 10,000 account, risking 1% per trade (AUD 100) on a bullish Bat pattern on EUR/USD with a 30-pip stop beyond D.
- Risk per trade: AUD 100
- Stop distance: 30 pips
- Position size: AUD 100 / 30 pips = AUD 3.33 per pip = roughly 0.33 standard lots (33,000 units)
- Margin required at maximum leverage: around AUD 1,200 (within account)
- First target at 0.382 AD: roughly 60 pips = AUD 200 (2:1 RR)
- Second target at 0.618 AD: roughly 90 pips = AUD 300 (3:1 RR)
Harmonic geometry is what makes this maths work. In my view, the tight stop beyond D combined with the meaningful AD target distance produces reward-to-risk ratios that classical patterns rarely match.
On gold (XAU/USD), the leverage cap drops to 20:1, below the major-pair figure, so adjust your margin calculation. ASIC also mandates negative balance protection and margin close-out at 50% of initial margin, but I would treat those as safety nets, not strategy substitutes. Our position size calculator runs the same arithmetic for any balance, risk percentage and stop distance.
Precise measurement is the whole game with harmonics, which is why the charting platform matters more here than on classical setups. Our guide to the best TradingView brokers in Australia covers which AU brokers support trading from an annotated chart. If the Fibonacci work is new, I would point you to the classical setups on our bullish chart patterns for Australian traders page as the gentler starting point, and the rest of the groundwork sits in our forex education hub.
FAQs
Are harmonic patterns better than classical chart patterns?
Can I rely on Autochartist to find harmonic patterns?
Do harmonic patterns work on AUD/USD?
What's the strike rate of a Gartley pattern in forex?
Are harmonic patterns suitable for beginners?
Related pages
About the author

Justin co-founded CompareForexBrokers in 2014 and has traded forex since 1998. Based in Melbourne, he has tested every ASIC-regulated broker on this site personally and has written for Forbes, Kiplinger, Finance Magnates, the Australian Financial Review and The Age. He holds a Bachelor of Commerce (Honours) and a Master of Marketing from Monash University. Justin is the co-founder and CEO of CompareForexBrokers.